Amid pandemic, core listeners prove their importance to news stations
Africa Studio / Shutterstock
In early March 2020 our lives were changed, suddenly and seriously, by the COVID pandemic. American families took shelter in their homes. Schools and universities closed, millions of jobs disappeared, no cars were driving the roads.
It was as if the Martians had landed.
And here is what happened, during March 2020, to radio listening:
- In markets across the country, radio listening crashed. Levels of persons using radio (PUMM in Nielsen terms) dropped by as much as 50%.
- Closer examination revealed that the loss of listening happened away from home. That made sense, given that people were staying in their homes.
- However, if you thought that radio users would simply transfer their out-of-home listening hours to the home location, that did not happen.
Keep in mind, we’re talking about persons using radio — the sum of all stations in a market — not the experience of each individual station.
One large market
Here’s a chart that illustrates the crash of radio listening in March. It is based on one large market.
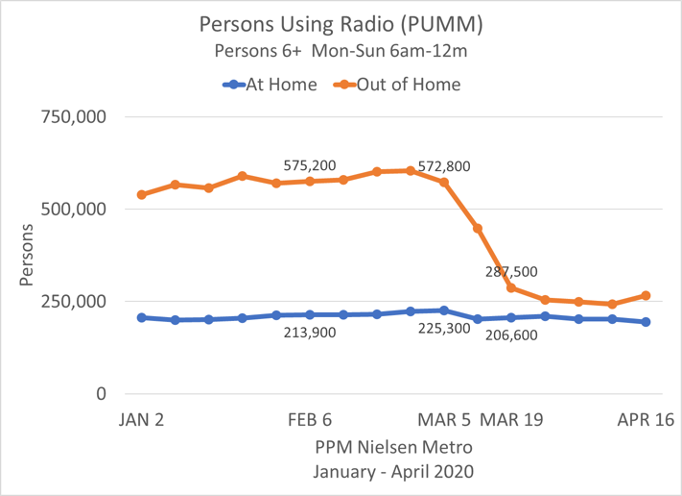
This is Nielsen’s Portable People Meter data, persons using radio in the metro, trending 16 weeks starting Jan. 2, 2020.
Note the importance of away-from-home listening. In this market, out of home used to be the dominant location of radio listening.
Keep in mind that PPM does not separate in-car vs. at work — both are included in out-of-home listening.
From the week of March 5 to the week of March 19, out-of-home radio listening crashed. Yet the blue line shows zero growth in radio listening at home!
In this large PPM market, the week of Feb. 6, there were 575,200 persons using radio, away from home, in a typical quarter-hour.
The at-home radio audience was smaller, at 213,900 persons.
By March 19, out-of-home crashed to 287,500.
Nielsen ratings
No doubt, if you work at a public radio station, you’ve been tracking the Nielsen ratings. That will give you standard audience estimates, ratings as designed for commercial radio, such as AQH and share.
Here’s a critical insight:
Let’s say your station has maintained its audience share.
If overall radio listening (PUMM) in your market has dropped, and you maintain share, your station has lost AQH audience.
Yet public radio is about delivering valuable programming to dedicated, supportive listeners.
How are we going to understand what COVID has done to public radio?
AudiGraphics
AudiGraphics is a sophisticated analysis of respondent-level Nielsen data.
The central concept in AudiGraphics is loyalty. David Giovannoni designed AudiGraphics to measure the loyalty of public radio listeners, especially the dedicated core listeners who support your station.
AudiGraphics also has the capability to aggregate Nielsen data for public radio across markets. If you’re programming an NPR News station, you want to know how other NPR News stations are doing. How is Morning Edition doing?
AudiGraphics allows us to analyze public radio stations by format, even to track network programs across stations.
For this special report, with the assistance of Lori Kaplan at NPR Research, we identified 91 NPR News stations that reach listeners in PPM markets.
Steve Olson, who distributes AudiGraphics through Audience Research Analysis, and Joanne Church at the Radio Research Consortium gave us permission to publish these findings.
We will show you how the audience has changed, April 2020 vs. April 2019.
Forward promotion
OK, you’re busy and want to know the major findings right away:
- Away-from-home listening crashed among NPR News listeners.
- But core listeners increased their loyalty to NPR News stations.
- For NPR News stations, core listeners are more important than ever.
- So now is the time to upgrade your sustainers, ask for higher giving.
Now follow along . . .
The tentpoles
Over four decades, ME and All Things Considered built the audience for NPR News stations and raised a lot of money. It would be reasonable to think that tentpole listening would increase in this time of national crisis.
AudiGraphics combined 91 NPR News stations in PPM markets. The thin line shows their weekday out-of-home listening, a year ago in April 2019. The dark line is the most recent data, April 2020.
We’re only looking at away-from-home listening — not at home.
At 8 a.m., Morning Edition lost about two-thirds of its out-of-home audience. At 5 p.m., ATC also lost about two-thirds of its out of home audience.
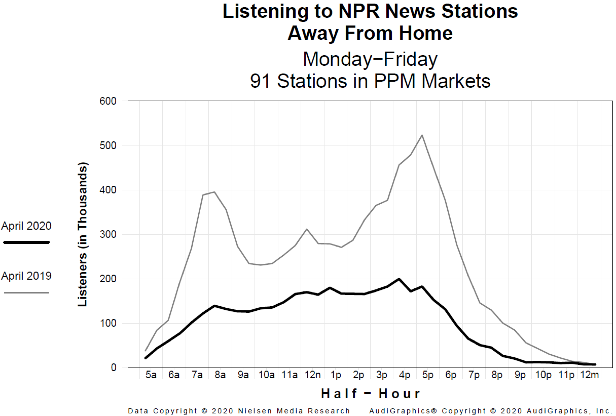
This is away-from-home listening — perhaps in-car or at work.
One year ago, in April 2019, NPR News stations in PPM markets enjoyed reliable peaks of listening from Morning Edition and ATC.
In April 2020, NPR News stations lost tentpole audiences — as well as midday listening — away from home.
Weekdays at home
This chart shows what happened to weekday listening in the home.
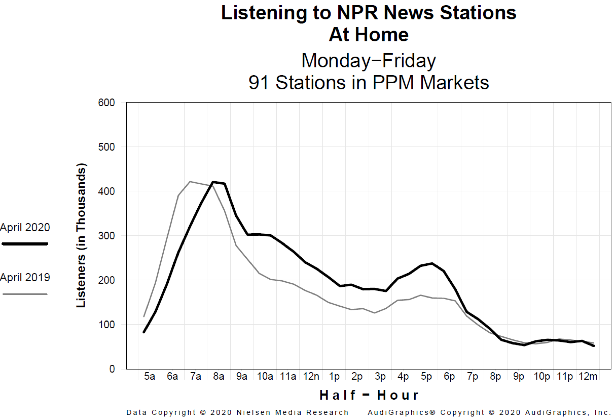
It would be reasonable to think that our target listeners would have more time available to enjoy the format.
The thin line for April 2019 shows that at home listening used to peak from 6–7 a.m. In April 2020 the dark line peaks at 8 a.m, not as early. There is no growth in ME at home.
But the big finding is that both lines show the same pattern. For at-home listening, amid the virus, the midday audience still declines 9 a.m.–3 p.m.
Now, it’s true that during the midday and ATC, the 2020 audience line runs somewhat higher than 2019. Yet, flipping back, you see that the modest growth of midday/ATC at-home listening did not compensate for the huge loss away from home.
From 9 a.m.–7 p.m., there is modest growth in listening at home. That growth is much smaller than the drastic loss of away-from-home.
ATC’s at-home audience still does not peak as high as ME at home, even though target listeners were likely to be at home.
Saturday
Here is away-from-home listening on Saturday.
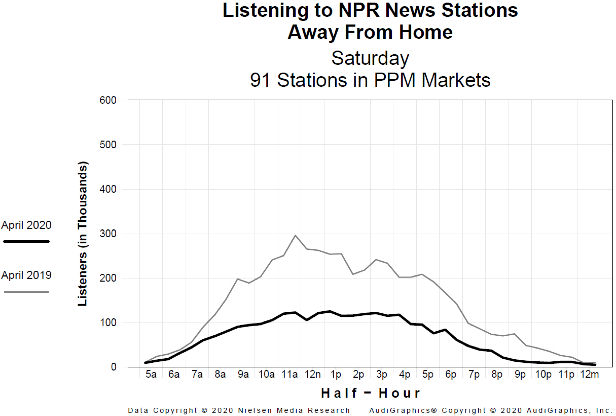
Midday is prime time for radio on Saturday. In 2019 the audience for NPR News stations climbed during Weekend Edition Saturday and peaked for Wait Wait.
The dark line shows the loss of away-from-home audience on Saturday as of April 2020.
Half of the midday audience is gone, due to the virus. Not surprising, given that people stayed closer to home, even on Saturday.
Here is the at-home listening to NPR News stations on Saturday.
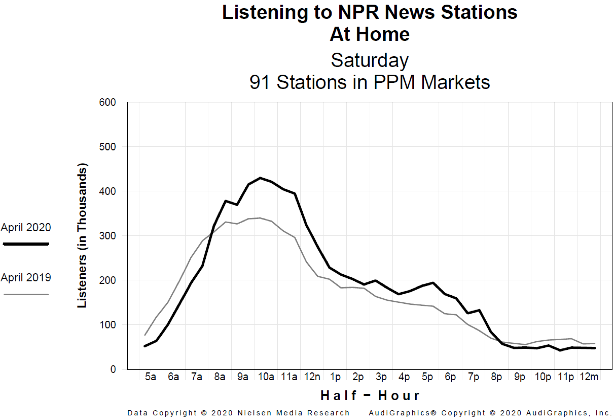
Our strong midday programs, anchored by WESAT and Wait Wait, grew more audience in April 2020. 10 a.m. to noon, at home, improved over 2019.
Yet the shape of Saturday at-home listening after noon didn’t change. In the afternoon the audience still falls off, with a minor bump at 5 p.m.
Sunday
This chart is Sunday away-from-home listening.
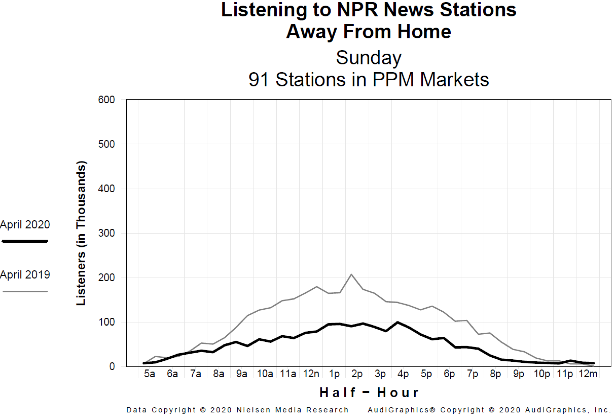
The thin line shows the traditional pattern: not much listening until 10–11 a.m. and a modest peak at 2 p.m.
The dark line shows April 2020 — same pattern but lower levels of listening to NPR News stations out of home on Sunday.
Here is the at-home audience on Sunday. The 9 a.m. peak is not as high as peak listening on Saturday.
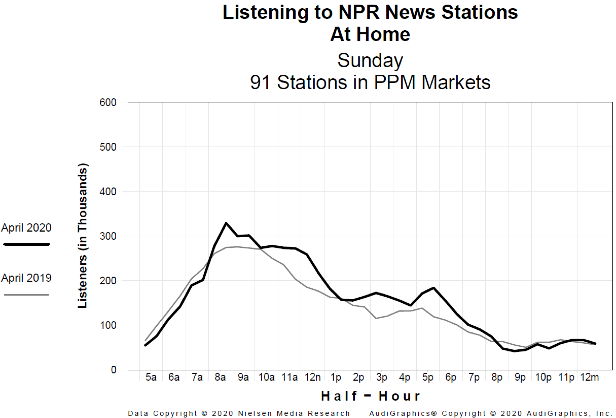
There’s not much difference between 2019 and 2020, just a little improvement in a few hours like 11 a.m. and 5 p.m.
On a positive note, NPR News stations did not lose Sunday at-home listening.
Core weekdays
Working with stations, we advise that this may be the most important chart in AudiGraphics. Core listeners (P1) generate most of the audience and reliable giving.
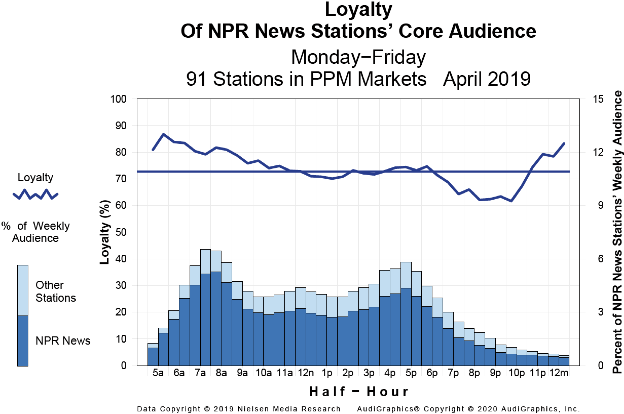
In April 2019, core listeners were 73% loyal to the NPR News station. The squiggly line shows above average loyalty early in the morning Monday–Friday.
Core listeners maintained high loyalty in the midday and through 5 p.m. In the evening they — like everyone — were less likely to use radio. For those who were using radio, their loyalty dipped 10 points.
Here is the core loyalty chart for weekdays April 2020.
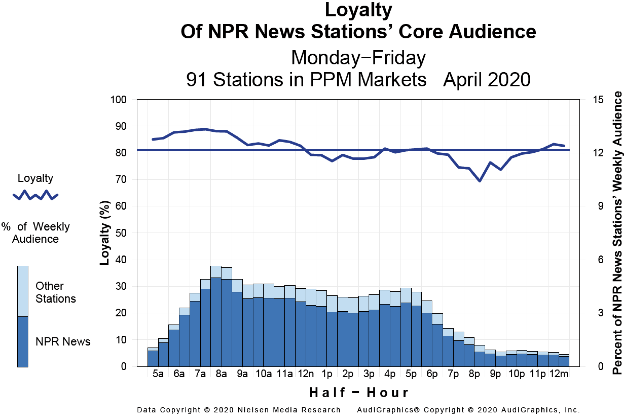
In relative terms, their loyalty improved, up to 81%.
But look closely at those bars. In absolute terms, core listeners used radio in 2020 less than they did in 2019.
Take 5 p.m. In 2019 the bar approached a 6 user rating, but in 2020 it’s about 4.5 (on the right axis).
In fact, our core listeners decreased their time spent listening to NPR News stations during the April epidemic.
Core Saturday
Here is the core loyalty chart for Saturday, April 2019.
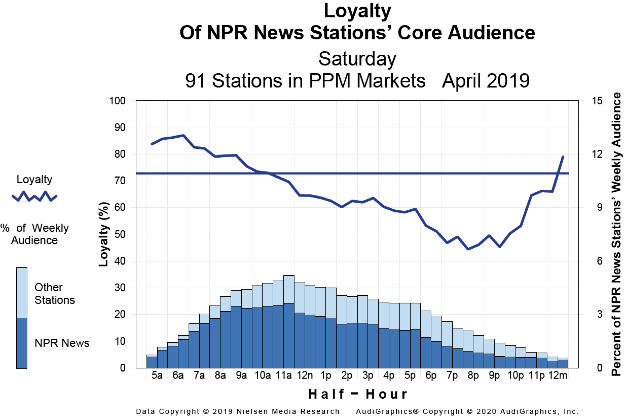
The squiggly line shows why NPR News stations tended to underperform on Saturday afternoon and evening. It was caused by declining loyalty by core listeners.
By 5 p.m. it was down to 60%, by 8 p.m. below 50%.
In fact, the light blue bars indicate listening to the competition — other stations being used by our core.
This chart shows core loyalty for Saturday, April 2020.
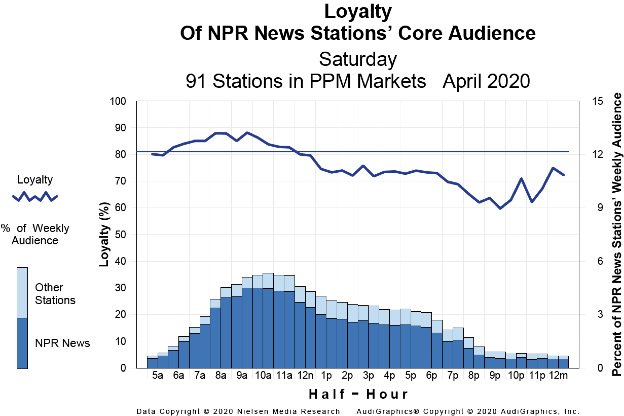
In the afternoon, the squiggly loyalty line is improved.
The light blue bars shrunk, meaning that our loyal core listeners were spending less time with the competition.
The dark blue bars are a little stronger, better for us.
In relative terms, the core loyalty improved on Saturday.
Core Sunday
In April 2019, core listeners started out Sunday morning with high loyalty to NPR News stations.
That loyalty decreased during the midday and afternoon.
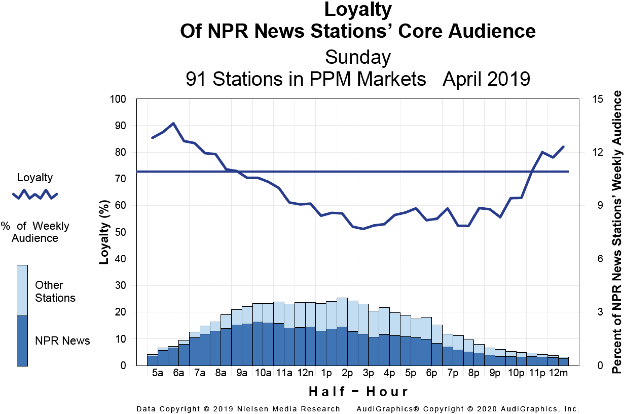
Look at 3 p.m. By that hour 50% of radio listening by our core listeners went to competing stations.
The light blue bars indicate core listeners choosing the programming on other stations, rather than ours.
Here is April 2020. On Sunday — just like Saturday — core loyalty improved in the afternoon.
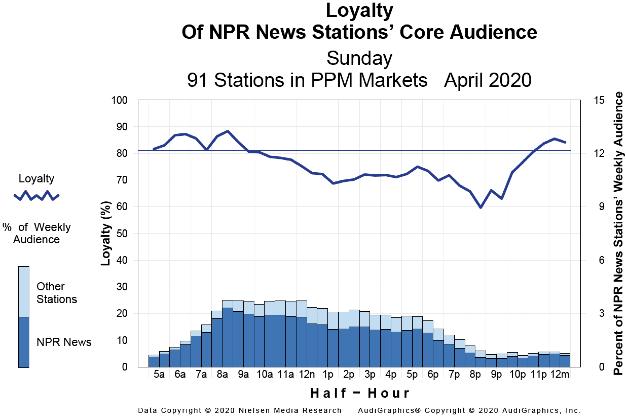
At 3 p.m. Sunday, core listeners were 70% loyal.
The dark blue bars are higher across the day, as core listeners increased their listening to NPR News stations.
The light blue bars are smaller, indicating less listening to competing stations.
Summary
Here is what happened to weekly cume.

NPR News stations in PPM markets lost 3 million weekly listeners, but the loss was fringe listeners. We held most of the core within our cume.
Here is what happened to Time Spent Listening.

NPR News stations in PPM markets did not grow or lose TSL among weekly listeners generally. Yet we lost an hour of listening in the core.
Here is what happened to Loyalty.

NPR News stations in PPM markets experienced improved loyalty overall, driven by even higher loyalty of core listeners. Fringe loyalty did not change.
Implications
If you skipped all the evidence and looked here:
- Listener support for NPR News stations should be secure.
- We know that because dedicated core listeners increased their loyalty.
- The lost cume consisted primarily of fringe listeners, who listen less often.
- Super-serve the core. Ask them to upgrade now.
Method
In terms of research design, the epidemic presented what we call a natural field experiment.
The independent variable was away-from-home radio listening. That variable was not manipulated by researchers, but we could measure the consequences out in the field.
The epidemic will pass, yet it’s possible that this field experiment revealed the near future for radio. Your next car, perhaps driverless, will include digital streams of audio, video and social media — dire competition for FM.
We could not have produced this report without the generous cooperation of Lori Kaplan at NPR, Joanne Church at RRC, Steve Olson at ARA and David Giovannoni, the designer of AudiGraphics.
March 2020 was the PPM month when radio use was changing from familiar patterns to a novel reality.
The PPM month of April 2020 consisted of 28 calendar days running March 26 to April 22.
David and Lori compiled a comprehensive list of 91 public radio stations that broadcast an NPR News format and reach listeners in PPM metro markets.
12 of those stations generate half of the listening:
| WAMU-FM | KOPB-FM |
| WNYC-FM | KERA-FM |
| KQED-FM | KUOW-FM |
| KPCC-FM | KUHF-FM |
| WBEZ-FM | WGBH-FM |
| KNOW-FM | WBUR-FM |
ARA intends to deliver custom monthly reports going forward for PPM May and June 2020, delivered to stations that subscribe to AudiGraphics.
Steve Olson’s email is steveara2019@hotmail.com or phone (240) 651-4640.
George Bailey is president of Walrus Research, an independent audience research firm with an established record of quantitative and qualitative projects for public radio stations, national producers and networks.