Who benefits most from CPB funding? A state-by-state look at station grants

Nelson_A_Ishikawa / iStock
In January of 1967, the Carnegie Commission on Educational Television published a report that forever changed broadcasting in the U.S. in two distinctive ways. First was the committee’s rebranding of “educational television,” then a nascent and loosely organized collection of nonprofit stations, into public television. Second was the conception of what is now the Corporation for Public Broadcasting.
Now, nearly 60 years later, the commission’s crown jewel is at risk of losing its funding. Opponents of public broadcasting are mostly focused on removing funding for NPR and PBS, but the path to achieving this goal in most proposed legislation is to defund CPB itself. Faced with the loss of public media’s chief financier, how do we evaluate the performance of CPB itself?
The Carnegie Commission’s very first charge was merely that public media “should reach all parts of the country,” so one way is by examining how CPB distributes Community Service Grants — or direct funding for local stations — to each state by population.
The United States of Public Media
In fiscal year 2023, CPB awarded over $336 million in Community Service Grants, or CSGs, to 543 public media stations and networks in the U.S. Using Census Bureau data from the same year, I found that, on average, CPB awarded $1.52 per person in total CSGs. The state-by-state data, however, is a different story: Per-person CSG funding awarded by CPB ranged from 11 cents all the way to $11.86.
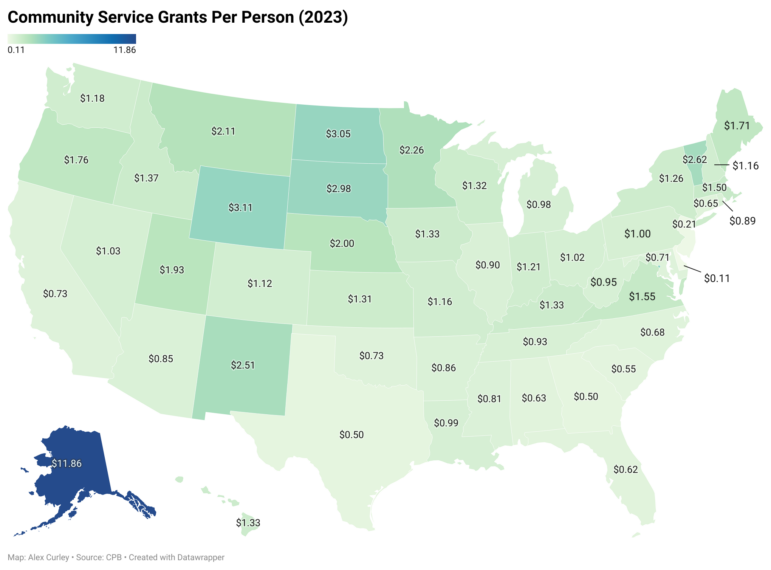
Most states hover in the $1-$3 per person range. Only Alaska managed to escape the upper bound, with CPB spending per person at $11.86. This shouldn’t be a surprise: Maintaining the broadcast infrastructure for a relatively small population dispersed across a very large and often unfriendly land mass is expensive — not to mention the paramount importance of keeping the only source of news for remote communities alive.
Otherwise, it’s difficult to spot any other trends just by looking at the heatmap. We can see a cluster of states in the Midwest that received higher-than-average grant money from CPB per person, but also a smattering of similar states along both seaboards.

Flipping the data to rank the CSG spending per person by state population, however, reveals something interesting: States whose population size ranked in the lowest third received on average much more funding per person than the other two-thirds of the country. Stated more simply, states with populations under 3 million on average received double the grant funding per person from CPB than that of the rest of the country.

Interestingly, states whose Electoral College votes went to President Trump in the last election received, on average, more CSG funding per person than states whose votes went to Vice President Harris. In fact, visualized in a pie chart, it looks remarkably similar to the Electoral College vote breakdown.
Final grade
So what does all this mean? We can say for certain that, in terms of CSG funding per capita, CPB generally spent more money on less populated states. We can also say that, despite a few blue-leaning outliers like the District of Columbia ($3.55 per person) and Vermont ($2.62 per person), public media stations in states that voted Republican in the last Presidential election tended to get more CSG money per person than in states that voted Democrat. These two may be related, however: Alaska ($11.86 per person), Wyoming ($3.11 per person) and the Dakotas ($3.05 and $2.98 per person, respectively) all topped the list for average CSG grant spending and voted Republican, but they also have populations of less than a million.
Ultimately, the fairness of CPB’s CSG distributions in 2023 boils down to what’s important for each individual viewing the data. On its website, CPB states that the mission of public media is to “provide universal access to high-quality educational programming in the United States, especially to underserved audiences.” If “universal access” and “underserved audiences” are the key phrases in the Corporation’s lofty mission, supporting stations that serve the northernmost tip of Alaska, the least-populated areas of the Dakotas and even territories like Guam and the U.S. Virgin Islands should earn CPB at least a passing grade.
As for me, I think about the dream of the Carnegie Commission: to create a “fundamental institution in American culture” that serves a wide range of audience sizes, “from the tens of thousands to the occasional tens of millions.” Nearly 60 years of dedicated funding have grown a system that serves a much wider range of audience sizes, now from the hundreds of millions to, more importantly, the hundreds. For this feat, I believe the CPB deserves an A+.
Alex Curley is a Product Manager and consultant based out of Asheville, N.C. He spent a decade at NPR, where he worked on the Public Radio Satellite System, NPR’s SiriusXM channel, national fundraising materials and newsroom promotional strategies.


Why are Maryland and Virginia ‘s numbers omitted from the map, while Connecticut is listed twice? Can you please update the map? Thanks!
Hi Dave, our apologies for the errors and thanks for pointing them out. We have corrected the map. — Mike Janssen, digital editor