Tame your data. Uncover new trends and boost your fundraising strategy
SPONSORED
By Susannah Winslow, Sr. Director Innovation & Partner Services (CDP)
There’s no shortage of data in public media. Sometimes it feels like we’re drowning in it, overlooking important metrics and trends in the flood of numbers. “Data overwhelm” is real, but you don’t have to go it alone. CDP Insights leverages station data in an easy to consume, less time intensive way so public media organizations can focus on making data-driven decisions that improve fundraising performance.
For over a decade, CDP has been helping stations make sense of their data by publishing system benchmarks across 30 of the most relevant Key Performance Indicators (KPIs) and comparing those results with an individual station’s performance in the Revenue Opportunity & Action Report—the ROAR.
Now, CDP is expanding on the proven value of these benchmarks by giving stations a suite of tools to efficiently gain deeper actionable insight on their donor file and fundraising performance. CDP Insights combines the power of the National Reference File with data analytics and visualization technology—a veritable one-stop shop for fundraising benchmarks specific to public media and trends specific to individual station donor files.
Bringing data into focus
One of the most powerful tools in combating overwhelming data is visualization. Visualization can help make the interpretation of data easy—easy-to-consume, easy-to-identify opportunities that are easy to share. CDP Insight’s suite of interactive data and reporting tools does just that through state-of-the-art business intelligence platform Tableau. And for the first time, CDP Insights is able to blend giving data with streaming data and demographic data so stations can track more benchmarks, identify more trends, discover more fundraising opportunities and ultimately drive more action and results.
Let’s make it a party
With CDP Insights, no station is a party of one. More valuable insights will be gained through regular discussion groups and in-person gatherings, allowing for deeper understanding of and context around trends and data to identify best practices, foster idea-sharing and surface learnings among public media colleagues. Stations will also have access to one-on-one analysis and report reviews with CDP’s Strategic Analyst, Deb Ashmore, to identify important findings, discuss fundraising goals and challenges, and brainstorm ways to improve fundraising performance.
With more than 25 years of years of experience in the nonprofit sector and public media fundraising, Ashmore most recently served as the principal data consultant at Blackbaud and is passionate about working to help clients understand their fundraising data to inform strategies for long-term file health and growth. Her previous public media experience includes 10 years as Director of Individual Giving for WXPN in Philadelphia.
“CDP is beyond excited to welcome Deb to our team,” said Michal Heiplik, President of CDP. “One of our core beliefs is that data-driven decision-making is the key to unlocking trapped fundraising potential for all nonprofits. Deb’s deep understanding of public media fundraising, along with her rich experience helping nonprofits, identifies areas of opportunity buried within data that will benefit our public media partners and underscores our commitment to maintaining a healthy ecosystem of local public media stations.”
Better than a Magic 8 ball
CDP Insights consists of two powerful tools that can help uncover new fundraising opportunities: benchmarking with ROAR+ and trend analysis with Sherlock.
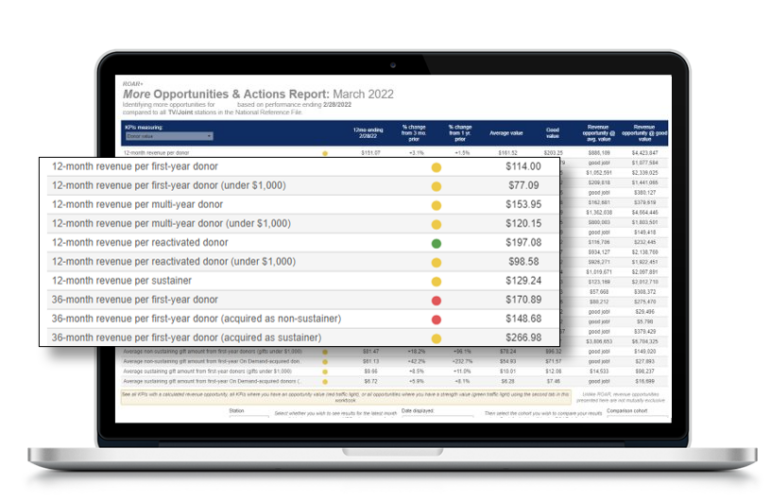
ROAR+ builds on the same framework stations have used to find opportunities from the ROAR but incorporates new sources of data to present findings from more than 100 new KPIs. With familiar ROAR concepts like the traffic light and revenue opportunities, stations are able to compare their fundraising performance to different station cohorts. The ROAR+ reporting suite will help stations answer questions like these:
Are we on track to reach our fundraising goals? What areas do we have to improve in?
The More Opportunities & Actions Report (MOAR) contains 150 Key Performance Indicators (KPIs) across 10 categories, presenting more detailed insights on how individual stations compare to the system in areas like file composition, donor value and donor retention.
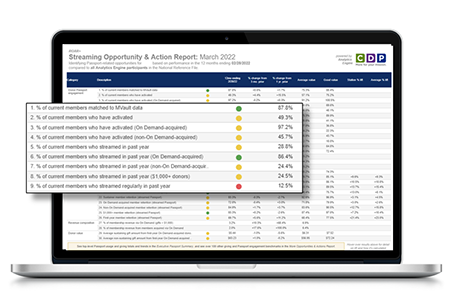
Are donors using Passport, and how does their use affect overall value?
The Streaming Opportunity and Action Report (SOAR) includes 30 KPIs specific to Passport engagement and value like average gift and percentage of Passport donors who give sustaining gifts.
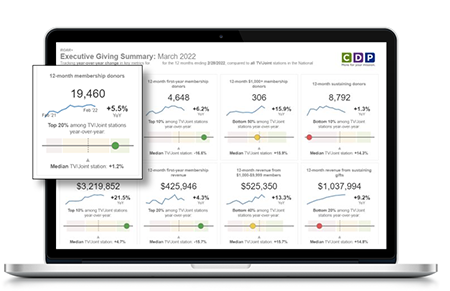
How does our performance compare to other public media organizations?
The Executive Summary is designed to give a quick, top-level way to compare a station’s year-over-year growth in key metrics to the trends of the system in an easily shareable way.
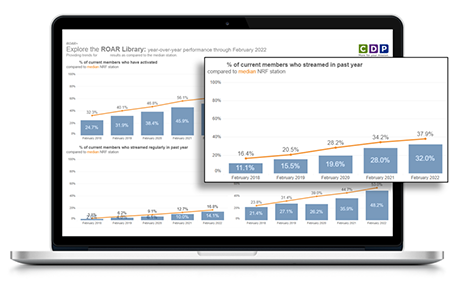
What are the long-term trends in our performance, and how do they compare to other public media organizations?
The KPI Trends report displays four KPIs from any category and compares up to five years of station results to the median result. Change the comparison group to see how results compare to all stations in the National Reference File, all TV/Joint or Radio stations or all stations of a similar size.
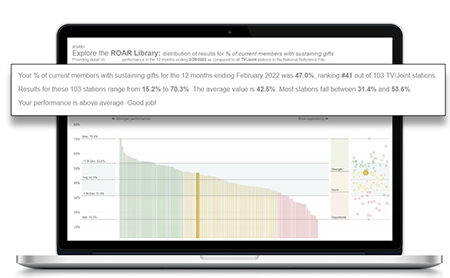
How much revenue can I generate by focusing on a specific area?
The KPI Distribution report identifies where individual stations rank among different groups of stations, seeing the anonymized result for any ROAR Library KPI in a distribution from biggest strength to most opportunity for improvement.
Sherlock dives deeper into a station’s donor file trends, delivering detailed, interactive analysis across multiple data sources. Blending giving data and streaming data with demographic data, there are literally hundreds of combinations to dynamically filter Sherlock’s suite of reports. Turn the dials and watch insights come alive, answering questions like these and more:
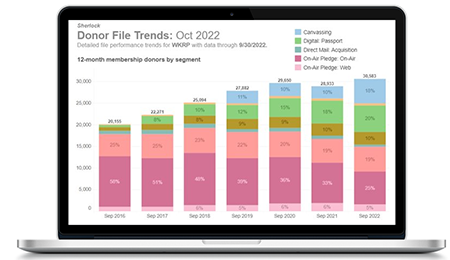
Which segments within member acquisition are trending up, and which need a retention boost?
The Donor File Trends reports explore donor and revenue retention, donor value, file composition and file segments through the lens of multiple data sources, including giving category, giving amount, streaming engagement, demographics and more.
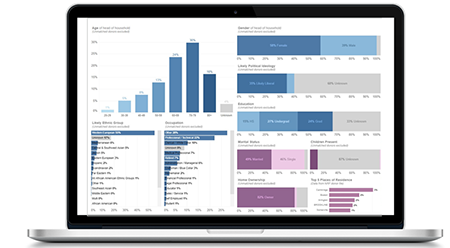
What is the trend in giving for 50-year-old donors in pledge? In Passport and online giving?
The Demographic Summary report provides deep context to a station’s donor file makeup in correlation to giving, exploring trends by giving category, first gift category, giving amount, streaming status and more.
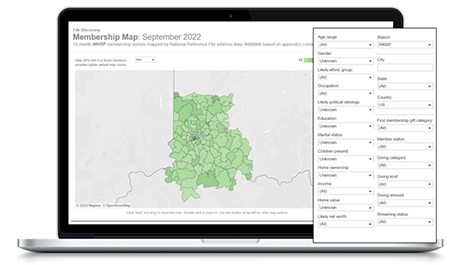
Based on donor concentration, which zip codes should we target to host our next station event?
The Membership Map is a geographic tool that places station donors in a “where context” that can help inform donor cultivation, retention, stewardship and recruitment strategies.
With CDP Insights, there’s no limit to the number of questions you can ask and the answers you can find. Knowing questions may evolve over time, this suite of reporting tools will continue to adapt and change well into the future based on new sources of data, new giving categories and new KPIs.
There’s never been a better time for stations to start taming their data and taking control of their fundraising performance with the easy-to-consume reporting and analysis of CDP Insights. Watch a demo or visit cdpcommunity.org/cdpinsights to learn more.

Contact Susannah Winslow for more information and to schedule a demo at swinslow@cdpcommunity.org
Founded as an initiative within GBH in 2011, CDP is now an independent public benefit corporation working on behalf of more than 260 public radio and television stations to share data across the system, analyze fundraising performance and develop best practices.