The Rural West On Fire
In January 2022, Lena Beck, a Master’s Student at the Environmental Science and Natural Resource Journalism master’s program at the University of Montana, pitched us an article about how she fled a wildfire from the Flathead Lake Bio Station while being a storytelling intern there. She wrote about the impacts of human-induced wildfires are creating an unprecedented season of destruction, and how local specialists are working to reverse that trend. Very few stories from the rural West get their time of the day; in the end, the piece was so popular that we decided to dedicate an open call on wildfires and extreme heat, forming the basis of these interlocking series of stories.
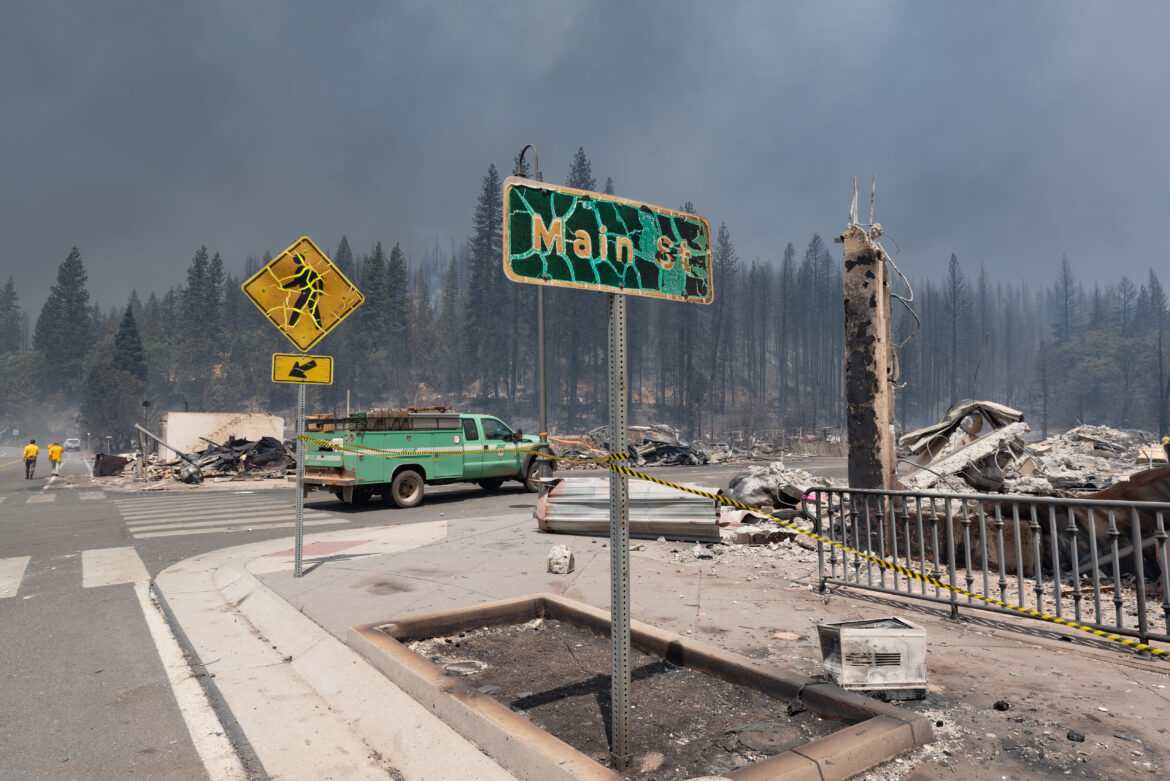
From Polson, Montana, (population 5,148) to Quincy, California (area population of 4,000), and the McKenzie River Valley, Oregon, we encouraged our writers to report in the first person; they have lived, worked or played in these regions, for extended periods, making them both experts and participatory figures. This allows our stories to be uniquely authentic, drawing readers into part of the actions, and laying clear the same emotional stakes that are proportional to the various impacts of climate change, including the despair of ecological and agricultural collapse, loss, and hope by pursuing equitable climate action.
As a student-run nonprofit newsroom ourselves, we consciously recruited and provided a platform for student and emerging journalists: in this series, all but one writer was an active student or within one year of graduating from their programs. This provided an opportunity for fresh takes on the issue. Our writers focused strongly on equitable local solutions, including reintroducing Indigenous controlled burning methods, increasing native plant vegetation in heavily-Hispanic, lower-income communities and innovative community engagement. This creates a replicable model of accurately showing these climate impacts while providing entry points for hope, action, and consensus-building.
Furthermore, we insisted on creating original data visuals that provide an interactive layer to the narrative. Our visuals include maps showing the extent of fires, and charts showing how much hotter and drier each region has become, and hydrology data. These allow lower-trust readers who may have trouble understanding climate and environmental science to play with the data themselves to trace each step we had taken to get to some of our reporting findings.