Why the impact of CPB funding cuts may not be equal

BrAt_PiKaChU / iStock
There’s been a dizzying amount of news related to public media’s federal funding recently. FCC Chair Brendan Carr opened an investigation Jan. 29 into the system’s underwriting practices. Four days later, Rep. Marjorie Taylor Greene called on the CEOs of NPR and PBS to testify in front of her Delivering on Government Efficiency subcommittee. Both sent letters that, in part, expressed explicit reservations about public media’s federal funding. It’s no wonder, then, that those of us working in or adjacent to public media are thinking more seriously about a future without CPB.
Much has been written about what would happen to the national networks, but the impact on individual stations and broadcasters is usually dismissed in a sentence or two. Like most, I’ve assumed that rural broadcasters were uniformly more dependent on CPB and that losing federal funding would be much more devastating for them. I also assumed that public television and radio broadcasters would be affected equally.
According to CPB, in fiscal year 2023 Community Service Grants made up an average of 10.6% of public television stations’ budgets and an average of 6% for public radio stations. But what about other types of CPB grants and other federal funding? Would public radio and television broadcasters share an equal burden? What does public media’s financial landscape actually look like? The answers to these questions, I’ve learned, are more complicated than we assume.
The data
In the product world, good answers only come from good data, so to get a clearer picture, I sifted through the public financial filings of 75 NPR and PBS affiliates. The broadcasters, chosen at random, consist of everything from statewide networks to university-run broadcasters to tiny stations. Total revenue is still king when applying for CPB grants, and I found that federal funding (derived from publicly available CPB Annual Financial Reports and mandated yearly financial audits) expressed as a percentage of a broadcaster’s total revenue was a reasonable approximation of how dependent they were on federal funding in FY23.
The data show that the average reliance on federal funding as a percentage of total revenue is somewhere around 13% among these specific broadcasters. Visualized on a graph, a broadcaster’s total revenue loosely correlates with how much it relies on federal funding. This probably isn’t a surprise. Indeed, nearly all of the broadcasters whose budgets consisted of more federal funding than average had total revenue of less than $9 million.
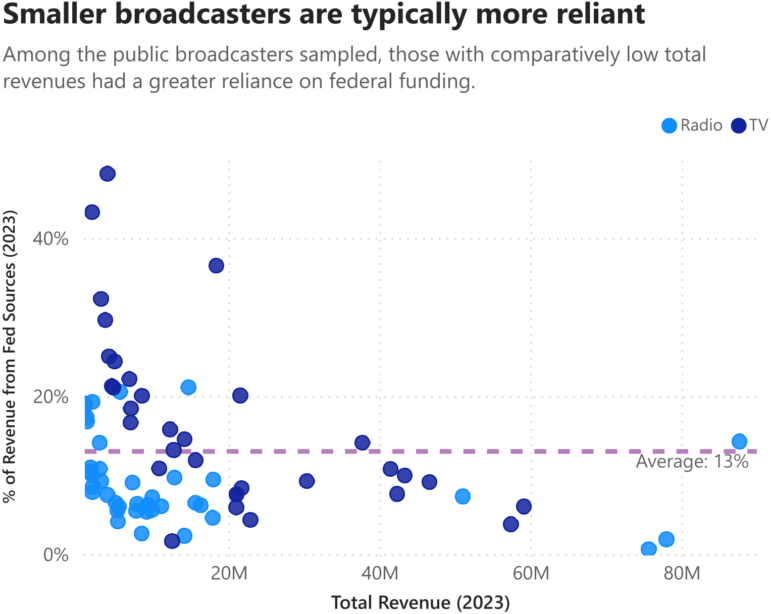
The comparison begins to fall apart, however, when grouping the randomly chosen broadcasters by medium. Federal funding made up around 10% of the average radio station’s budget, with the most dependent barely rising above the 20% mark. On the other hand, federal funding accounted for about 17% of the average television station’s revenue. Two television stations even jumped past the 40% mark.
The differences between television and radio stations become more stark when the stations are organized by Nielsen market rankings. Because Nielsen ranks radio and television markets differently, I decided to place every broadcaster, whether radio or television, into its equivalent Nielsen radio market to maintain consistency. A lower numerical market ranking corresponds to a larger population density, so for the purposes of this study, we can assume that the higher the numerical market ranking, the more rural the population is likely to be.
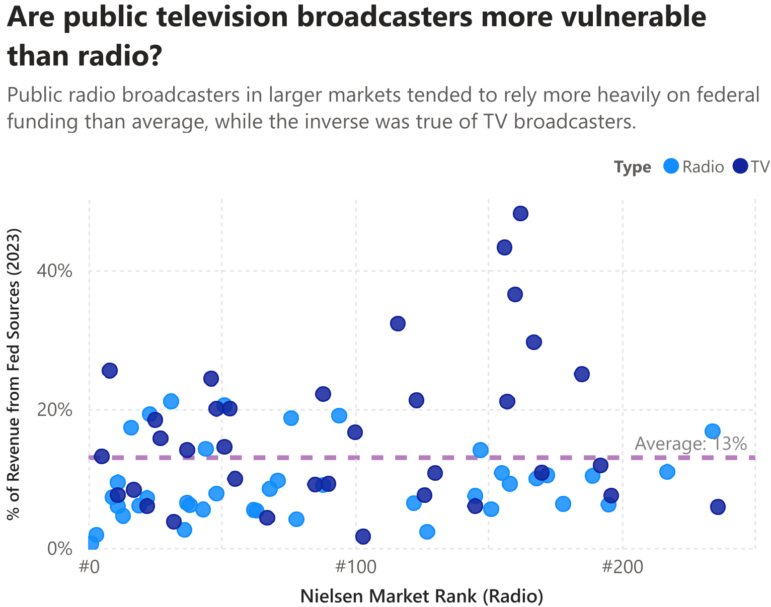
When graphed out, it becomes clear that losing federal funding is, of course, a much bigger threat to public television broadcasters in smaller markets than it is to their counterparts in larger markets, though not uniformly so. It also becomes clear that public radio broadcasters do not face the same level of threat. In fact, when isolated, the data show that the most vulnerable public radio broadcasters in this study seem to be in larger markets. Most of the radio broadcasters with above-average reliance on federal funding were in the top 100 Nielsen radio markets, while the most reliant television broadcasters were outside of the top 100. Interestingly, both mediums contained an even distribution of broadcasters with below-average reliance across all market ranks.
What’s next
So what does all this data mean? What could we expect if public media lost federal funding? Every organization’s financial situation is unique, but generally we can assume that public television broadcasters will have a tougher time financially than public radio broadcasters. As I discussed earlier, public radio’s average reliance on federal funding was 10%, while public television’s was 17%. Ask any business owner which amount they’d rather lose from their yearly revenue and the answer should be clear.
Additionally, every studied broadcaster that relied on federal funding for 25% or more of its total revenue was a television station, most of which operated outside of a regional or statewide network. These broadcasters also tended to be the only stations in their respective markets. This suggests that, in the short term, closure would become more likely than consolidating with nearby competitors, especially in less-populated areas — a very worrying possibility.
As for radio, the tune is the same but in a slightly different key: Radio broadcasters that relied on federal funding for more than the average 13% of their budget are at a much greater risk than their counterparts, but they tend to be in larger market areas. Closure is also a possibility for these high-risk broadcasters, but their concentration in larger markets suggests that they may be able to tap their large constituent base to stay afloat longer with donations and local grants, or they may choose to consolidate with competitors.
The upside
No study is perfect. On its website, CPB says it has around 540 public media grantees, making this a sample size of around 14%. Additionally, all of these randomly selected broadcasters are NPR or PBS affiliates, leaving out broadcasters whose financial dependence may differ drastically. On the whole, this study shows us a snapshot of one financial year among a certain group of public media broadcasters.
Even so, the good news is that public media broadcasters that have a below-average dependence on federal funding seem to be evenly distributed across all market sizes. As I have discussed, the common assumption is that small broadcasters are uniformly at risk while large broadcasters are not. The reality, as we see in the data above, is much more complicated.
As public media professionals, we have a duty to address “the needs of unserved and underserved audiences” and make our work “available to all citizens of the United States” — the sacred mission of the Public Broadcasting Act of 1967 — even if CPB goes away. We also have a duty to discuss what’s at risk with our colleagues and audience to help prepare for the worst. That can only happen if we have an honest, evidence-based understanding of how much we actually rely on federal funding.
Alex Curley is a Product Manager and consultant based out of Asheville, N.C. He spent a decade at NPR, where he worked on the Public Radio Satellite System, NPR’s SiriusXM channel, national fundraising materials and newsroom promotional strategies.
Correction: An earlier version of this article incorrectly referred to the Public Broadcasting Act of 1969. The act was enacted in 1967.


I appreciate this analysis, but direct CPB funding to local public media organizations is only part of the story. CPB also provides funding for system infrastructure and content, and the elimination or reduction in that funding would also have a profound impact on these organizations and how they serve their local communities.
All the public NPR and public television stations are left leaning and as such, should align center or have their funding heavily reduced or stopped period. With cable, satellite and multiplex television signals there is no longer a need for public radio and TV. They should follow the demise of the buggy whip.